> ## Documentation Index
> Fetch the complete documentation index at: https://docs.pangolin.net/llms.txt
> Use this file to discover all available pages before exploring further.
# Metrics
This is a community guide and is not officially supported. If you have any issues, please reach out to the [author](https://github.com/Lokowitz).
This is a basic example of collecting metrics from Traefik and CrowdSec using Prometheus and visualizing them with Grafana dashboards.
Important for users with low-powered server (1GB RAM):
This setup will increase the use of your server RAM.
## Configuration
### Traefik
For claiming metrics from Traefik we have to adjust some configuration files.
1. Update the `docker-compose.yml` file of the Pangolin stack to expose metrics port `8082` for the Prometheus connection:
```yaml theme={"theme":"gruvbox-light-hard"}
service:
gerbil:
ports:
- 8082:8082
```
Docker’s NAT-based port publishing feature automatically exposes all `ports:` defined in `docker-compose` file. This behavior can bypass your host firewall settings, potentially exposing services that you did not intend to make public.
Please see [complete warning about exposing ports](/self-host/dns-and-networking).
2. Update the `/config/traefik/traefik_config.yml` file to include the following:
```yaml theme={"theme":"gruvbox-light-hard"}
entryPoints:
metrics:
address: ":8082"
metrics:
prometheus:
buckets:
- 0.1
- 0.3
- 1.2
- 5.0
entryPoint: metrics
addEntryPointsLabels: true
addRoutersLabels: true
addServicesLabels: true
```
3. Restart the Gerbil and Traefik container to apply the changes:
```bash theme={"theme":"gruvbox-light-hard"}
sudo docker restart traefik gerbil
```
### Crowdsec
For claiming metrics from Crowdsec we have to adjust the docker compose files.
1. Update the `docker-compose.yml` file of the Pangolin stack to expose metrics port `6060` for the Prometheus connection:
```yaml theme={"theme":"gruvbox-light-hard"}
service:
crowdsec:
ports:
- 6060:6060
```
Docker’s NAT-based port publishing feature automatically exposes all `ports:` defined in the `docker-compose` file on all network interfaces. This behavior can bypass your host firewall settings, potentially exposing services that you did not intend to make public.
Please see [complete warning about exposing ports](/self-host/dns-and-networking).
2. Restart the Crowdsec container to apply the changes:
```bash theme={"theme":"gruvbox-light-hard"}
sudo docker restart crowdsec
```
## Prometheus
1. Create a new Prometheus container or add it to `docker-compose.yml` of Pangolin stack:
```yaml theme={"theme":"gruvbox-light-hard"}
services:
prometheus:
container_name: prometheus
image: prom/prometheus:latest
restart: unless-stopped
ports:
- 9090:9090
volumes:
- /etc/timezone:/etc/timezone:ro
- /etc/localtime:/etc/localtime:ro
- ./config/prometheus/prometheus.yml:/etc/prometheus/prometheus.yml
- ./config/prometheus/data:/prometheus
```
Docker’s NAT-based port publishing feature automatically exposes all `ports:` defined in the `docker-compose` file on all network interfaces. This behavior can bypass your host firewall settings, potentially exposing services that you did not intend to make public.
Please see [complete warning about exposing ports](/self-host/dns-and-networking).
2. Create a `prometheus.yml` file in the `/config/prometheus` directory with the following content:
```yaml theme={"theme":"gruvbox-light-hard"}
global:
scrape_interval: 15s
evaluation_interval: 15s
scrape_configs:
- job_name: "prometheus"
static_configs:
- targets: ["localhost:9090"]
- job_name: traefik
static_configs:
- targets: ["172.17.0.1:8082"]
- job_name: crowdsec
static_configs:
- targets: ["172.17.0.1:6060"]
```
3. Create a folder `data` in `/config/prometheus` and change the owner and owning group:
```bash theme={"theme":"gruvbox-light-hard"}
chown nobody:nogroup data
```
4. Start the Prometheus container:
```bash theme={"theme":"gruvbox-light-hard"}
sudo docker compose up -d
```
## Grafana
1. Create a new Grafana container or add it to `docker-compose.yml` of Pangolin stack:
```yaml theme={"theme":"gruvbox-light-hard"}
services:
grafana:
image: grafana/grafana:latest
container_name: grafana
restart: unless-stopped
ports:
- 3000:3000
volumes:
- /etc/timezone:/etc/timezone:ro
- /etc/localtime:/etc/localtime:ro
- ./config/grafana/data:/var/lib/grafana
```
Docker’s NAT-based port publishing feature automatically exposes all `ports:` defined in the `docker-compose` file on all network interfaces. This behavior can bypass your host firewall settings, potentially exposing services that you did not intend to make public.
Please see [complete warning about exposing ports](/self-host/dns-and-networking).
2. Start the Grafana container:
```bash theme={"theme":"gruvbox-light-hard"}
sudo docker compose up -d
```
Default login credentials for Grafana admin user is admin:admin.
### Add Prometheus Connection
Add the Prometheus connection under Connections -> Add new connection.
Set `http://172.17.0.1:9090` as `Prometheus Server URL` and click `Save & test`.
### Add Dashboard
Add a Dashboard under Dashboard -> New -> Import and import a pre configured Dashboard or create your own.
#### Traefik
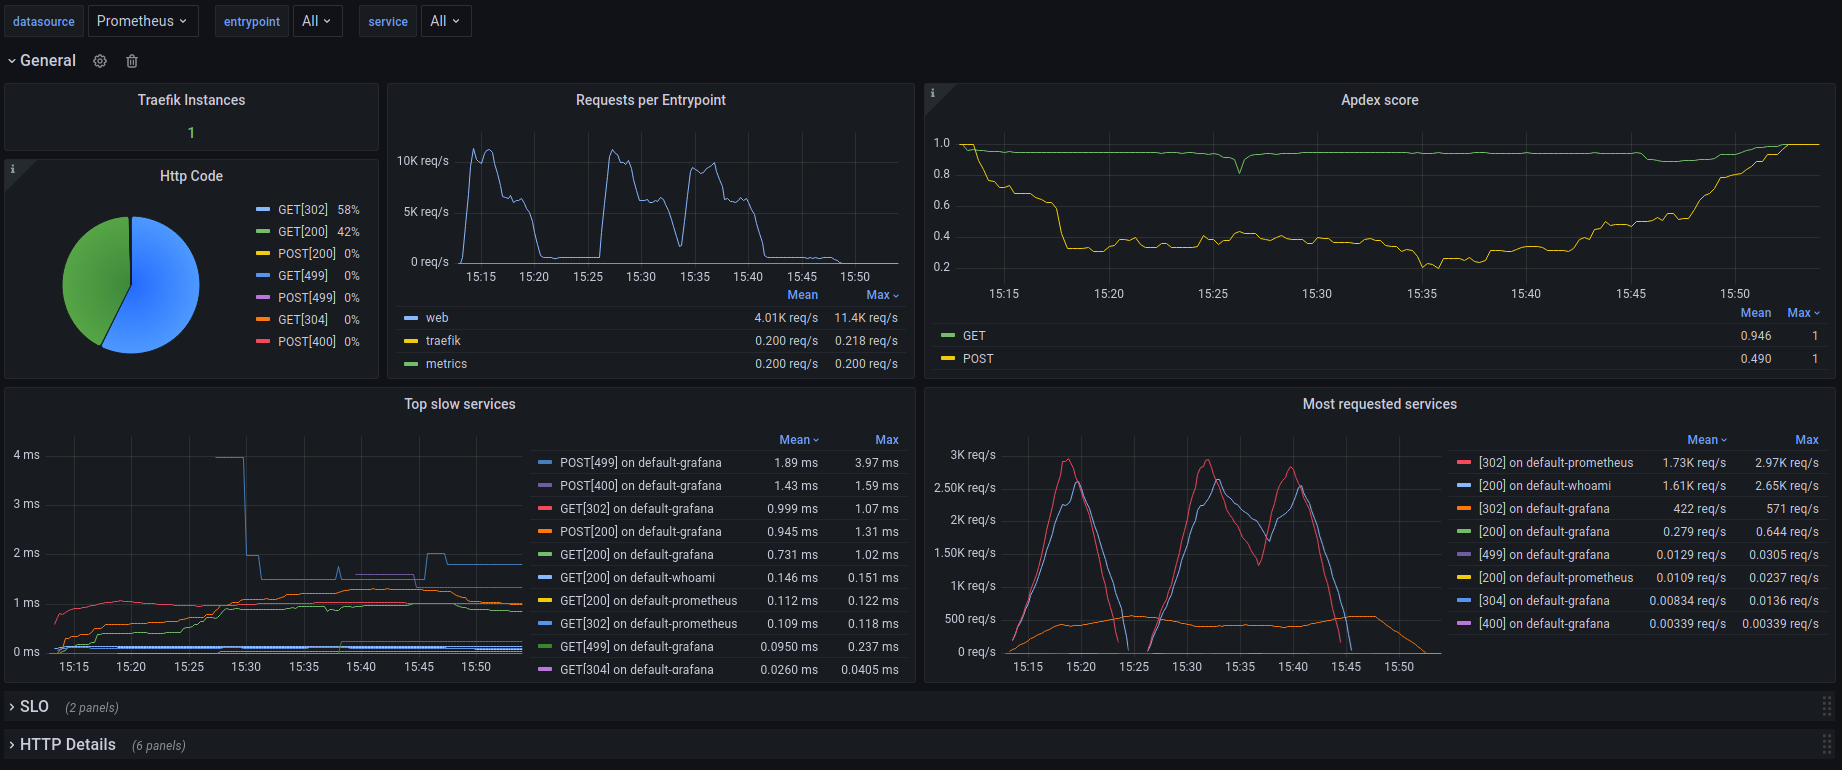 Template Import ID = 17346
[https://grafana.com/grafana/dashboards/17346-traefik-official-standalone-dashboard/](https://grafana.com/grafana/dashboards/17346-traefik-official-standalone-dashboard/)
#### Crowdsec
[https://github.com/crowdsecurity/grafana-dashboards/tree/master](https://github.com/crowdsecurity/grafana-dashboards/tree/master)
Template Import ID = 17346
[https://grafana.com/grafana/dashboards/17346-traefik-official-standalone-dashboard/](https://grafana.com/grafana/dashboards/17346-traefik-official-standalone-dashboard/)
#### Crowdsec
[https://github.com/crowdsecurity/grafana-dashboards/tree/master](https://github.com/crowdsecurity/grafana-dashboards/tree/master)