

AI Usage Analytics
Cost, token usage, and request volume across providers, resources, roles, users, and keys
Usage analytics rolls up every AI Gateway call: how many requests ran, how many tokens they used, and estimated USD. Open AI Gateway → Usage Analytics. The numbers come from the same recorded usage that budgets enforce.
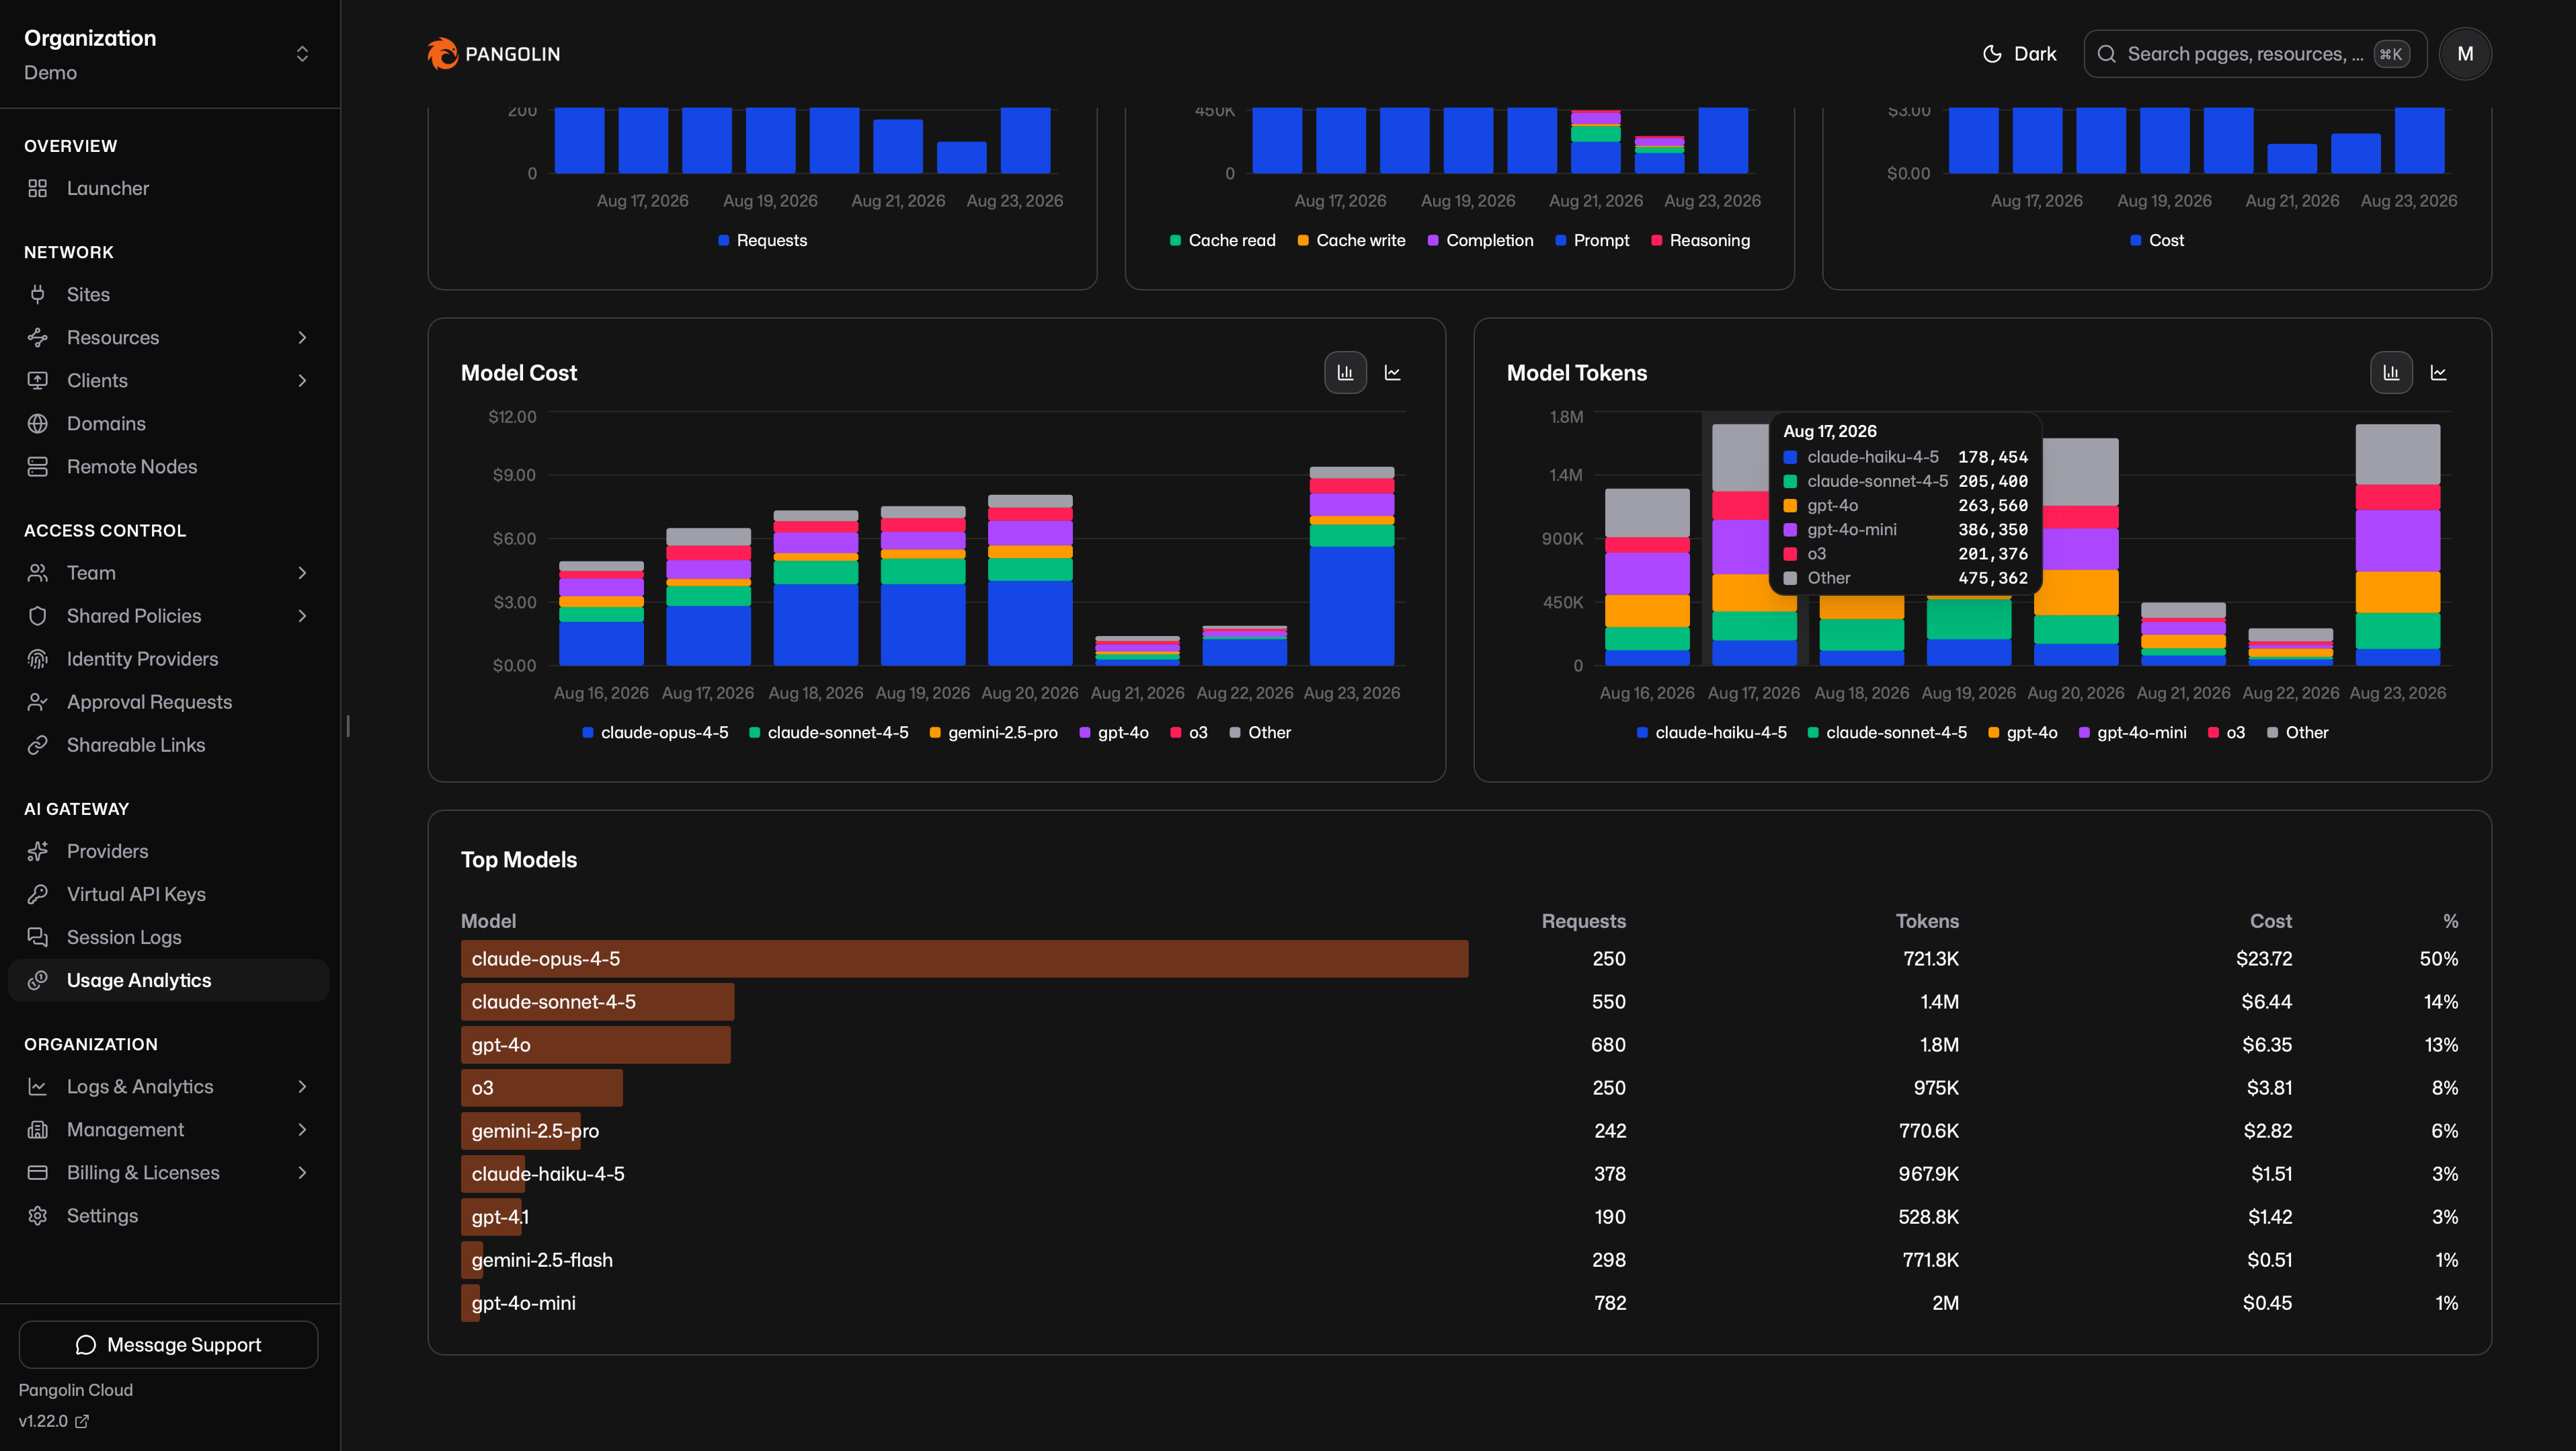
These records are independent of session log retention. For prompt and response text, see Session Logs. The two share a session id per call.
How Numbers Are Calculated
USD uses catalog rates (in, out, cache, reasoning) when the model id is known. Unknown models have no USD amount. Tokens still sum.
Token buckets are prompt, cache-read, cache-write, completion, and reasoning. If the upstream omits usage, Pangolin estimates tokens from the request and response. Overview shows Estimated: the share of requests that used that path.
A non-2xx response from the provider still counts as a request with zero tokens, so volume charts include failed attempts.
These figures are estimates for the dashboard and for budgets, not a copy of the vendor invoice. See Budgets for the same calculation used at enforcement time.
Filters
Every tab uses the same filters. The default date range is the last seven days.
- Provider
- Model
- Resource
- Role
- User
- Virtual API key
Tabs
Overview shows totals for requests, tokens, cost, and estimated percent, daily charts for each, and top models by cost.
Providers, Resources, Roles, Users, and Virtual API Keys each show cost and token trends plus a ranked list for that dimension.
Role is derived from the caller's org roles. Usage rows store the user id, not the role. A manual key with no attributed user appears as an unknown user.
Was this page helpful?